25 Aug HOW TO USE ANALYTICS FOR PPC AND ADWORDS
How to Use Analytics for PPC and Adwords
Using Analytics and Adwords can become a daunting task for the unsavvy. The online world is expanding every day. Individuals and groups are increasingly carving a niche in its limitless space every minute. With this enormous potential, the Internet has become a hub for business activities, with increased marketing opportunities. However, with the continued proliferation and the constant battle for traffic, there is a need to evaluate how much of your online campaigns and activities reach your target.
That is not all. If you’re running pay-per-click campaigns (PPC) or advertising on AdWords, you want to know how people are interacting with your site and marketing messages. This is where Analytics comes in. It is important to assess your marketing efforts, so you can better plan for future campaigns and know where you need to improve. This guide will show you how to use analytics for PPC and Adwords, so that you can take advantage of its huge benefits.
What is Web Analytics?
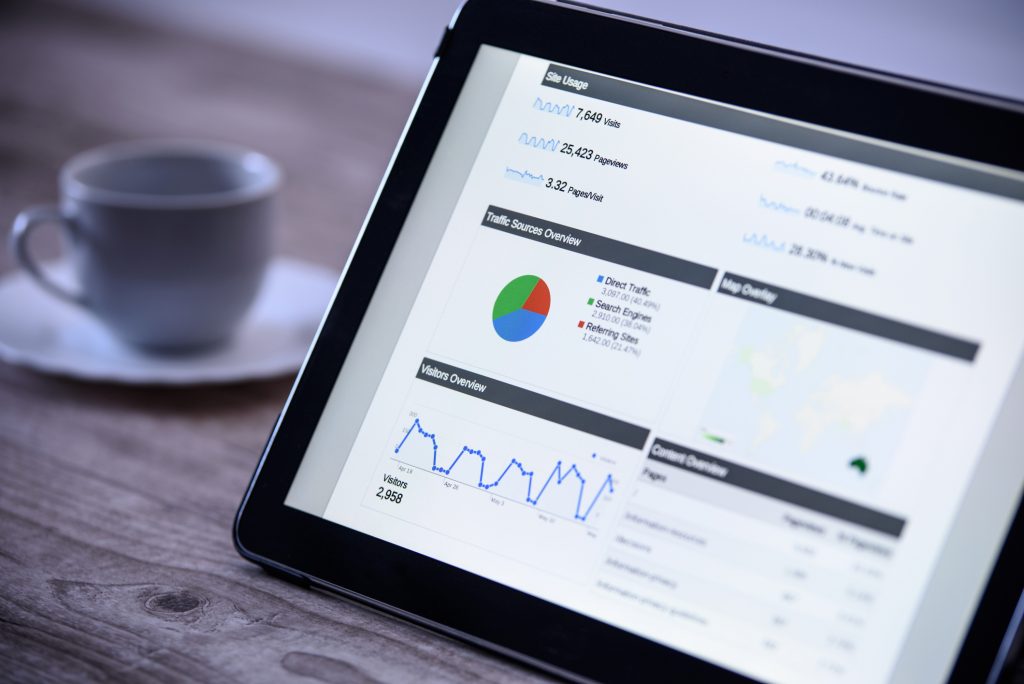
Analytics is a broad term in the fields of mathematics, statistics, and computer programming. Contextually, it refers simply to a process of measuring web traffic and web user behaviors in order to help website administrators manage their sites better. It is fast becoming an important part of business communications management and has been recognized as a crucial tool for success.
Web analytics helps you assess what parts of your online campaign visitors interact with the most. It also helps you analyze trends, segment visitors, and identify choke points that prevent visitors from accomplishing objectives on your site. It is also important for Search Engine Optimization (SEO). With all of this, you can know how profitable your PPC advertising and Adwords marketing are and what you need to do, if you need to improve conversion rates.
But how do you use analytics for PPC and AdWords? It is important to understand the numerous dynamics before you can efficiently utilize whatever results from analytics. Apart from Google analytics which you probably already know about, there are some other platforms, including;
-
Piwik Analytics:
Piwik recorded 1 million users by July, 2017. It is a very popular, especially because it is an open and free source web analytics. The application was written by a team of international developers who sought to provide a competitive alternative to Google analytics, with Matthieu Aubry as its known creator. What it does majorly is to track visits to a particular website, and display them for proper analysis. With under a hundred million websites on the internet, Piwik had 1.3% of that figure as users of its application in July.
This application which began in 2007 has witnessed tremendous evolution since then. In fact, in November 2008, SourceForge.net reintroduced Piwik to developers as a hosted application. It has remained a strong force since then. Just last year, the establishment of InnoCraft Ltd by Aubry made it possible for professionals to buy premium plugins including Search Engine Keywords, Form Analytics, A/B Testing and Heatmap.
-
Cyfe:
In 2012, Daven Patel, a web software engineer, founded Cyfe Inc as a business intelligence application software. It is called a freemium because, although the software is provided for free, some payment is made for proprietary features. Based in Los Angeles, this application software is designed to track and monitor several business metrics in a single place. A dash app is a key feature of the company; able to analyze, transform and report data from integrated business intelligence sources.
Currently available in 15 countries globally, the company continues to grow and expand, establishing itself as a global web support system. However, it was in 2013, that Cyfe began to offer proper analytics services to businesses and websites around the world. With cyfe, you can analyze large sets of data from sources such as Google AdWords, Facebook, Google AdSense, Twitter, Shopify, SalesForce, and so on.
-
Open Web Analytics:
The Open Web Analytics software was created by Peter Adams. It is an open source web analytics software, meaning anyone can install and run it on their own host. This makes it unique from Google analytics which is completely offered by Google. It uses a MySQL database and written in PHP, giving it compatibility with several other web servers. This app conveniently tracks and observes the number of views on your website, as well as tracking those of your competitors.
One good thing about OWA is the freedom it offers. You can practically own it after a download and run it on your own host. It is greatly compatible with WordPress and WikiMedia.
-
Clicktale:
Clicktale has been described as a cloud-based Software-As-A-Service analytics system that enables you to see what your customers do on your website, especially from their own perspective. You can analyze interactions on your site as heatmap aggregate and reports, having the ability to replay individual sessions. By finding website issues, you can greatly increase conversion rates and, as a result, increase your revenue.
Clicktale was founded in 2006 by Dr. Tal Schwartz and Arik Yavilevich. It is available in 102 countries and serves over 25,000 optimized websites. Using JavaScript, client-side recording, consumer-rendered HTML is captured mostly on a session-by-session basis and allows you to replay such sessions and monitor what they did on your site, including what they typed into fields.
Using Analytics for PPC and or AdWords
Using analytics requires that you know what reports it offers and where to find them. I will be focusing on 6 major variables in analytics, with information on how to use them.
- Organic Keyword Report:

We all know how important it is to use the right keywords when we generate content for our websites. However, the challenge has always been the inability to know what words play in the heads of consumers who make searches. This is where analytics comes in. By providing reports on your PPC keyword viability, it does not only show you where you need to improve but helps you carry out a keyword research and offers a keyword planner.
How to Use it…
In Google analytics, you can find this report by following the simple steps; Acquisition-Keywords-Organic. A table, like the one above, should appear showing you the keywords and every other detail you need to know. The benefit is that you can find terms that are already bringing in conversion traffic. When combined with historical Adwords data and the keyword planner, this report can change your business for good.
- Devices (Organic Segment)

It is equally important to determine the expected results of a particular device before you use it. Desktop computers, tablets and other mobile devices yield different analytics results. Know which one suits your website and attract the most visits. This will help you plan your site better and yield more revenues.
How to Use it…
You can calculate which bid modifier to use for any particular device so that you can hit your targets. Do this by first reviewing the conversion rate for every device. Go to Audience-Mobile-Overview to find this analysis. Also, to change the segment to “Organic traffic”, click “All Sessions”. A clue is to begin with a -50% bid if the conversion rate is 50% of tablets.
- Keyword Position:

I suggest you compare bounce rate, conversion rate and other metrics between the different ad spots for focus keywords. The keyword position report is done between top and side positions. Comparing those rates between the different ad positions will provide a more accurate result. This is because the position for each click is moved into Google AdWords.
How to Use it…
To locate this report, click Acquisition-Adwords-Keyword Positions. Identify the high-volume keywords and review the conversion rate for each of them. This will help you determine what I term the “hot spot”, or “sweet spot” according to some other experts. You should check if position 1 generates a high bounce rate (poorer quality traffic) on selected keywords as a result of accidental clicks.
- Product Performance:

This will simply help you determine what products are top sellers using factors such as revenue, volume, and Average Order Value. The major question here is; “what are they buying?” It provides a useful insight into how customers are interacting with and reacting to, your products. With such detailed metrics, you will know the next step to take towards improving your business.
How to Use it…
Top-selling products should be reviewed and compared to the keyword coverage. You want to be sure that your keywords are actually working. Keywords are an important factor for SEO. You should target strong, visible keywords for top products, so that they can do better.
- Time Lag:

Your PPC and AdWords campaigns won’t make much sense if you do not ascertain the time lag on your web analytics. It is simply the difference in time between the first date of interaction and the date of conversion within the same look back window. A good example of this is shown above. You should use this report to ascertain the actual AdWords cookie length. For Google analytics, the standard campaign cookie length is 6 months.
How to Use it…
Review the percentage of conversions and the value on the current AdWords cookie window in the last 6 to 12 months. If you find that an account has a high percentage of conversion and increased revenue after a period of one month, you might want to expand your AdWords cookie length. Ordinarily, you’d have less data to review if you focused on the AdWords time lag report. Click Conversions-Multi-Channel-Funnels-Time Lag to see this report.
Also, check to see if there are lost attributions and calculate the value. This result will help you determine what adjustments you need to make to your conversion tracking settings. It will also help you determine the best time to make bid optimizations. A trajectory of conversions and revenue based on time lags from the past can be made.
- Landing Pages:

With data on landing pages, you gain unlimited access to all entry points to your site. You will see how all these entry points are performing from all channels. And if you’re using GA, you can go beyond previous PPC landing pages.
How to Use it…
To find landing pages, go to Behaviour-Site Content-Landing Pages. By using this feature, you can tell which pages are more viable for paid search traffic. You can also see what pages work best for searches by narrowing your result to the organic traffic section. You can discover major breakthrough pages you didn’t know about before and decide which page works best for what.
Tips on Using Analytics for PPC and AdWords
The major objective of analytics is to create a better, active and more profitable website. Here are some tips to consider when using analytics for PPC and SEO;
Identify your Customers’ Needs
One major thing to do is to identify your customers’ needs. If you can better satisfy the needs of people who visit your site, you’ll have a better chance at an increased revenue. There is a growing concern about carts abandonment, with many statistics showing it is four times higher than the rate of sales. The fact that analytics helps identify what sales path records the highest cart abandonment, it can help you identify areas that need improvement.
Identify your Objectives
To better achieve your objectives, you would need to create specific goals. Know what parts you need to improve and what actions you need to take. Once you can identify the problem you want to solve, determine how best to solve it, using realistic and definitive methods. If your goal is to increase sales by a certain percentage, you can decide to make your page more user-friendly by reducing the processes involved in making a purchase.
Analyse your Metrics
This analysis saves you the stress of going through a ton of data you might not need. By classifying these metrics, you can pay attention to only those data that will help your business. The major variables to consider are whether new visitors are attracted to your site, how much time they spend on it, where they spend the most time, how loyal they are to your site, what their buying behaviors are, and so on. These are some of the factors that can actually help improve sales.
Data Collection
Whether you’re using web server log data or the more recent JavaScript page tagging, your accounting log file will help you capture micro details of user interaction. You can determine cross-side traffic and page flows among sites by aggregating data from distinct websites. The application service provider (ASP) hosted solution model, which uses the JavaScript page tagging, is becoming more popular because it presents a lesser barrier to entry than the software solution.
You can simply sign up to a client-side solution, pay setup fees and monthly fees depending on monthly traffic, and get a tag. This tag provided by the vendor is designed to detect data about your visitors. Once the code is added to your site, data is sent to your vendor’s database once a visitor downloads your pages. This is because your pages have coded tags already.
Conclusion:
Since PPC requires that you pay for every click on your ad, it is important that such a click by any user results in a sale. Your keywords bid on AdWords should also yield positive results. All these issues can be efficiently resolved if you know how to use analytics. This knowledge will help boost your SEO, and lead to increased sales and revenue for your business. This guide has provided some tips on how to use analytics for PPC and Adwords. Get started and you can thank me later.
No Comments